Rationale
There are at least three major steps when doing single-locus species delimitation analysis:
Preparing your data;
Running species delimitation analysis;
Visualizing results.
The rationale of delimtools is to provide functions for all these steps. This guide introduces you to these functions and shows how to apply them to your datasets. In this tutorial, we will use the geophagus dataset provided in this package. This dataset contains 354 cytochrome c oxidase sequences of the Geophagus sensu stricto species group downloaded from GenBank. Most of these sequences are from Ximenes et al. (2021) and are documented in ?geophagus.
Preparing your data
Usually, our main source of information for single-locus species delimitation analysis is a FASTA formated file containing nucleotide sequences. The most straightforward way to import a FASTA formatted file into R Environment is by using ape::read.FASTA():
path_to_file <- system.file("extdata/geophagus.fasta", package = "delimtools")

geophagus <- ape::read.FASTA(file = path_to_file)
Since the geophagus dataset is provided along with delimtools, one can simply call it directly:
geophagus
#> 354 DNA sequences in binary format stored in a list.
#>
#> All sequences of same length: 690
#>
#> Labels:
#> MZ504301.1
#> MZ504328.1
#> MZ504318.1
#> MZ504313.1
#> MZ504311.1
#> MZ504312.1
#> ...
#>
#> Base composition:
#>     a     c     g     t
#> 0.237 0.282 0.178 0.303
#> (Total: 244.26 kb)
Check identifiers across files
Although the header of each FASTA file may contain both an ID and a Description, we recommend keeping the header simple and only using ID. The metadata (the Description) are easily stored in a tabular format file (e.g. csv, tsv, xlsx, etc.), and linked to the FASTA file via the ID. We provide such metadata in Darwin Core format. One can have a glimpse of our Geophagus sequence metadata by checking geophagus_info:
dplyr::glimpse(geophagus_info)
#> Rows: 354
#> Columns: 19
#> $ scientificName        <chr> "Geophagus_altifrons", "Geophagus_altifrons", "G…
#> $ scientificNameGenBank <chr> "Geophagus altifrons", "Geophagus altifrons", "G…
#> $ class                 <chr> "Teleostei", "Teleostei", "Teleostei", "Teleoste…
#> $ order                 <chr> "Cichliformes", "Cichliformes", "Cichliformes", …
#> $ family                <chr> "Cichlidae", "Cichlidae", "Cichlidae", "Cichlida…
#> $ genus                 <chr> "Geophagus", "Geophagus", "Geophagus", "Geophagu…
#> $ dbid                  <dbl> 2063684375, 2063684465, 2063684523, 2063684453, …
#> $ gbAccession           <chr> "MZ504486.1", "MZ504531.1", "MZ504560.1", "MZ504…
#> $ gene                  <chr> "coi", "coi", "coi", "coi", "coi", "coi", "coi",…
#> $ length                <dbl> 659, 699, 627, 612, 552, 654, 627, 651, 666, 609…
#> $ organelle             <chr> "mitochondrion", "mitochondrion", "mitochondrion…
#> $ catalogNumber         <chr> "1614", "17578", "1616", "1194", "2748", "1610",…
#> $ country               <chr> "Brazil: Tapajós- Jacareacanga- Pará", "Brazil: …
#> $ publishedAs           <chr> "Mapping the hidden diversity of the Geophagus s…
#> $ publishedIn           <chr> "Unpublished", "Unpublished", "Unpublished", "Un…
#> $ publishedBy           <chr> "Ximenes,A.M.", "Ximenes,A.M.", "Ximenes,A.M.", …
#> $ date                  <chr> "25-OCT-2021", "25-OCT-2021", "25-OCT-2021", "25…
#> $ decimalLatitude       <dbl> -6.276008, -3.449100, -6.276008, -1.501489, -6.1…
#> $ decimalLongitude      <dbl> -57.74000, -57.73533, -57.74000, -52.68211, -48.…
For downstream visualization, all FASTA IDs should have associated metadata; however, the metadata may have more entries than sequences in the FASTA file. The function check_identifiers() will check if all FASTA IDs have entries in the metadata, and if there are any duplicate IDs either in the FASTA file or in the metadata. Let’s check if our FASTA file has associated metadata check_identifiers():
check_identifiers(dna = geophagus, identifier = "gbAccession", data = geophagus_info)
#> ✔ Identifiers passed all checks.
Now, let’s omit the first 10 sequences and check again:
check_identifiers(geophagus[11:354], "gbAccession", geophagus_info)
#> ✔ Identifiers passed all checks.
Now, let’s omit the first 4 metadata entries and check again:
check_identifiers(geophagus, "gbAccession", geophagus_info[5:354,])
#> Error in `check_identifiers()`:
#> ! Identifiers missing from metadata.
#> ✖ The following identifiers occur in sequence data `geophagus` but are absent
#>   from metadata `geophagus_info[5:354, ]`.
#> ℹ Missing identifiers:
#> MZ504525.1, MZ504531.1, MZ504560.1, MZ504486.1
Many other functions of delimtools rely on a tabular format file like geophagus_info, so please make sure to have one prior to any analysis.
Cleaning DNA and Haplotype Collapsing
Sometimes, our alignment file may contain non ACTG bases, like ambiguities (N, R, Y, etc), gaps (-), or missing data (?). Inclusion of these bases in delimitation analyses may have unintended consequences in delimitation analyses. We can use the function clean_dna to remove these ambiguities. clean_dna will remove both leading and trailing gaps from the alignment, therefore it will be necessary to realign the dataset after calling clean_dna.
geophagus_clean <- clean_dna(geophagus)
#> Warning: ⚠ You have missing data "('N','-' '?')" or ambiguity inside your sequence, i.e.
#> not padding the ends, and this may have unintended consequences later, as they
#> have now been removed!
#> ℹ The names of the samples are below.
#> GU701784.1, GU701785.1
# and display
geophagus_clean
#> 354 DNA sequences in binary format stored in a list.
#>
#> Mean sequence length: 646.198
#>    Shortest sequence: 505
#>     Longest sequence: 690
#>
#> Labels:
#> MZ504301.1
#> MZ504328.1
#> MZ504318.1
#> MZ504313.1
#> MZ504311.1
#> MZ504312.1
#> ...
#>
#> Base composition:
#>     a     c     g     t
#> 0.237 0.282 0.178 0.303
#> (Total: 228.75 kb)
The presence of identical sequences (haplotypes) in an alignment will overestimate the number of lineages detected by tree-based species delimitation methods (e.g. bGMYC, GMYC, PTP, mPTP). Therefore it is best practice to collapse identical haplotypes into unique haplotypes. This is accomplished by calling the hap_collapse function. By default the function will also call clean_dna.
geophagus_collapsed <- hap_collapse(geophagus)
#> Warning: ⚠ You have missing data "('N','-' '?')" or ambiguity inside your sequence, i.e.
#> not padding the ends, and this may have unintended consequences later, as they
#> have now been removed!
#> ℹ The names of the samples are below.
#> GU701784.1, GU701785.1
# and display
geophagus_collapsed
#> 137 DNA sequences in binary format stored in a list.
#>
#> Mean sequence length: 643.007
#>    Shortest sequence: 505
#>     Longest sequence: 690
#>
#> Labels:
#> MZ504301.1
#> MZ504318.1
#> MZ504341.1
#> MZ504337.1
#> MZ504342.1
#> MZ504304.1
#> ...
#>
#> Base composition:
#>     a     c     g     t
#> 0.238 0.281 0.177 0.304
#> (Total: 88.09 kb)
Notice that from the initial 354 DNA sequences, hap_collapse returned a total of 136 unique DNA sequences. This result may vary if setting collapseSubstrings to FALSE:
geophagus_collapsed <- hap_collapse(geophagus, collapseSubstrings = FALSE)
#> Warning: ⚠ You have missing data "('N','-' '?')" or ambiguity inside your sequence, i.e.
#> not padding the ends, and this may have unintended consequences later, as they
#> have now been removed!
#> ℹ The names of the samples are below.
#> GU701784.1, GU701785.1
# and display
geophagus_collapsed
#> 246 DNA sequences in binary format stored in a list.
#>
#> Mean sequence length: 639.764
#>    Shortest sequence: 505
#>     Longest sequence: 690
#>
#> Labels:
#> MZ504301.1
#> MZ504328.1
#> MZ504318.1
#> MZ504341.1
#> MZ504337.1
#> MZ504299.1
#> ...
#>
#> Base composition:
#>     a     c     g     t
#> 0.237 0.282 0.177 0.303
#> (Total: 157.38 kb)
After setting collapseSubstrings to FALSE, we obtained 246 unique DNA sequences. These additional 108 sequences are in reality shorter but identical sequences which differ only by the presence of leading and trailing gaps. By setting both clean_dna and collapseSubstrings to TRUE, the default of hap_collapse, we ensure the removal of these leading and trailing gaps from sequences before collapsing these sequences into unique haplotypes.
To visualize the relationships between these unique haplotypes and any duplicates, we may use the haplotype_tbl function:
haplotype_tbl(geophagus, verbose = FALSE)
#> # A tibble: 137 × 3
#>    labels     n_seqs collapsed
#>    <chr>       <dbl> <chr>
#>  1 MZ504318.1     38 MZ504328.1, MZ504313.1, MZ504311.1, MZ504312.1, MZ504309.1…
#>  2 MZ504540.1     20 MZ504505.1, MZ504553.1, MZ504554.1, MZ504552.1, MZ504542.1…
#>  3 MZ504420.1     19 MZ504417.1, MZ504437.1, MZ504425.1, MZ504427.1, MZ504422.1…
#>  4 MZ504488.1     16 MZ504538.1, KU568830.1, JN026709.1, MZ504522.1, MZ504523.1…
#>  5 MZ504484.1     15 MZ504496.1, MZ504487.1, MZ504573.1, MZ504560.1, MZ504497.1…
#>  6 MZ504462.1     14 MZ504479.1, MZ504477.1, MZ504481.1, MZ504476.1, MZ504463.1…
#>  7 MZ504375.1     13 MZ504372.1, MZ504382.1, MZ504381.1, MZ504379.1, MZ504383.1…
#>  8 MZ504535.1      8 MZ504515.1, MZ504525.1, MZ504533.1, MZ504534.1, MZ504536.1…
#>  9 MZ504393.1      8 MZ504445.1, MZ504413.1, MZ504407.1, MZ504408.1, MZ504410.1…
#> 10 MZ504400.1      6 MZ504404.1, MZ504401.1, MZ504402.1, MZ504403.1, MZ504399.1
#> # ℹ 127 more rows
We may also collapse other types of information by using collapse_others. For example we may take the collapsed haplotype table and onto it collapse our metadata to see, for example, which species and sampling localities are associated with each haplotype:
haps_df <- haplotype_tbl(geophagus, verbose = FALSE)
collapse_others(data = geophagus_info,
hap_tbl = haps_df,
labels = "gbAccession",
cols = c("scientificName", "country"))
#> # A tibble: 137 × 5
#> labels n_seqs collapsed collapsed_scientific…¹ collapsed_country
#> <chr> <dbl> <chr> <chr> <chr>
#> 1 MZ504318.1 38 MZ504328.1, MZ504… Geophagus_proximus Brazil: Lago do …
#> 2 MZ504540.1 20 MZ504505.1, MZ504… Geophagus_altifrons, … Brazil: Tocantin…
#> 3 MZ504420.1 19 MZ504417.1, MZ504… Geophagus_sp.1 Brazil: Branco- …
#> 4 MZ504488.1 16 MZ504538.1, KU568… Geophagus_altifrons, … Brazil: Água Boa…
#> 5 MZ504484.1 15 MZ504496.1, MZ504… Geophagus_altifrons Brazil: São Seba…
#> 6 MZ504462.1 14 MZ504479.1, MZ504… Geophagus_sp.3 Brazil: Iriri- P…
#> 7 MZ504375.1 13 MZ504372.1, MZ504… Geophagus_megasema Brazil: Mamirauá…
#> 8 MZ504535.1 8 MZ504515.1, MZ504… Geophagus_altifrons Brazil: Maués-Aç…
#> 9 MZ504393.1 8 MZ504445.1, MZ504… Geophagus_sp.1 Brazil: Xingu- u…
#> 10 MZ504400.1 6 MZ504404.1, MZ504… Geophagus_sp.1 Brazil: Demeni- …
#> # ℹ 127 more rows
#> # ℹ abbreviated name: ¹collapsed_scientificNameRunning species delimitation analysis
After preparing your data (alignments and phylogenetic trees), the next step it to run species delimitation analyses and combine them into a single tbl_df. As of v0.3.0, delimtools includes executables of the ABGD, ASAP, GMYC, bGMYC, PTP and mPTP methods, therefore, it requires no outside dependencies to run these delimitation methods.
Following are examples of species delimitation methods implemented in delimtools. The first three methods are distance-based methods and thus use the full aligned sequence matrix. Subsequent methods are tree-based methods; the phylogenetic trees need to be estimated externally, and should be based on unique haplotypes. For the convenience of this vignette, we provide the full data matrix (geophagus), a phylogram (geophagus_raxml) and a time-tree (geophagus_beast) as part of this package.
ABGD
The ABGD method is run by executing the abgd function and giving it an ape::DNAbin object which is a S3 R object containing an aligned FASTA file. It will also accept a path to an aligned FASTA. The result is then transformed into a table using the abgd_tbl function.
# geophagus - the `ape::DNAbin` object supplied with this package

abgd_delim <- abgd(geophagus)
#> Simple distance
abgd_df <- abgd_tbl(abgd_delim)

# print the dataframe
print(abgd_df)
#> # A tibble: 354 × 2
#>    labels      abgd
#>    <chr>      <int>
#>  1 MZ504301.1     1
#>  2 MZ504328.1     1
#>  3 MZ504318.1     1
#>  4 MZ504313.1     1
#>  5 MZ504311.1     1
#>  6 MZ504312.1     1
#>  7 MZ504309.1     1
#>  8 MZ504341.1     1
#>  9 MZ504337.1     1
#> 10 MZ504299.1     1
#> # ℹ 344 more rows
ASAP
The ASAP method is run by executing the asap function and giving it an ape::DNAbin object. It will also accept a path to an aligned FASTA. The result is then transformed into a table using the asap_tbl function.
# geophagus - the `ape::DNAbin` object supplied with this package

asap_delim <- asap(geophagus)
asap_df <- asap_tbl(asap_delim)

# print the dataframe
print(asap_df)
#> # A tibble: 354 × 2
#>    labels      asap
#>    <chr>      <int>
#>  1 MZ504301.1     1
#>  2 MZ504328.1     1
#>  3 MZ504318.1     1
#>  4 MZ504313.1     1
#>  5 MZ504311.1     1
#>  6 MZ504312.1     1
#>  7 MZ504309.1     1
#>  8 MZ504341.1     1
#>  9 MZ504337.1     1
#> 10 MZ504299.1     1
#> # ℹ 344 more rows
Local Minima
We can run the Local Minima analysis by using the spider function localMinima. This function requires a genetic distance matrix as input for analysis.
dist_mat <- ape::dist.dna(geophagus, model = "raw", pairwise.deletion = TRUE)

locmin <- spider::localMinima(dist_mat)
#> [1] 0.006828358 0.018994392 0.040791871 0.055999413 0.067151612 0.082105695
We can plot the locmin object to select the threshold. We will use the first value of the locmin object:
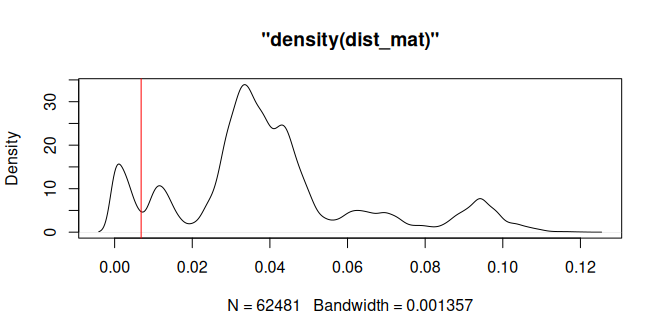
Since Local Minima output is a numeric vector, we need to extract the results using locmin_tbl.
locmin_df <- locmin_tbl(dist_mat, threshold = locmin$localMinima[1])

print(locmin_df)
#> # A tibble: 354 × 2
#>    labels     locmin
#>    <chr>       <int>
#>  1 MZ504301.1      1
#>  2 MZ504328.1      1
#>  3 MZ504318.1      1
#>  4 MZ504313.1      1
#>  5 MZ504311.1      1
#>  6 MZ504312.1      1
#>  7 MZ504309.1      1
#>  8 MZ504341.1      1
#>  9 MZ504337.1      1
#> 10 MZ504299.1      1
#> # ℹ 344 more rows
We can use patristic distances to generate species partitions as well. Using the geophagus_beast tree, we can apply a threshold to classify tips of the tree by using its branch lengths:
dist_mat_tr <- ape::cophenetic.phylo(as.phylo(geophagus_beast)) |>
  as.dist()

locmin_tr <- spider::localMinima(dist_mat_tr)
#> [1] 0.1114476 0.2020889 0.3527801

plot(locmin_tr) |>
  abline(v=locmin_tr$localMinima[1],col="red")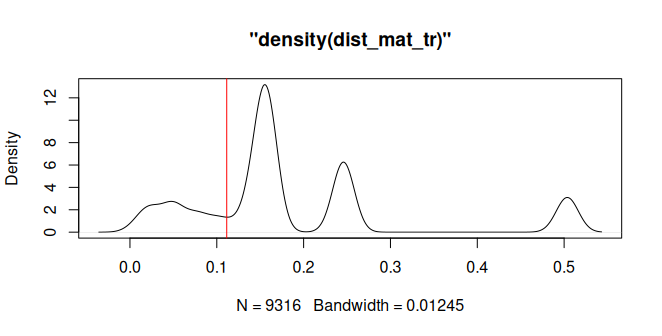
treedist_df <- locmin_tbl(dist_mat_tr,
                          threshold = locmin_tr$localMinima[1],
                          delimname = "treedist")

print(treedist_df)
#> # A tibble: 137 × 2
#>    labels     treedist
#>    <chr>         <int>
#>  1 GU701784.1        1
#>  2 GU701785.1        1
#>  3 JN988869.1        1
#>  4 MH780911.1        1
#>  5 OR732927.1        1
#>  6 OR732928.1        1
#>  7 MZ050845.1        2
#>  8 MZ051032.1        2
#>  9 MZ051706.1        2
#> 10 MZ051794.1        2
#> # ℹ 127 more rows
Fixed threshold
Finally, we can also use locmin_tbl to create a species partition using a fixed threshold. For example, we can use a threshold of 2% to generate species partitions:
percent_df <- locmin_tbl(dist_mat, threshold = 0.02, delimname = "percent")

print(percent_df)
#> # A tibble: 354 × 2
#>    labels     percent
#>    <chr>        <int>
#>  1 MZ504301.1       1
#>  2 MZ504328.1       1
#>  3 MZ504318.1       1
#>  4 MZ504313.1       1
#>  5 MZ504311.1       1
#>  6 MZ504312.1       1
#>  7 MZ504309.1       1
#>  8 MZ504341.1       1
#>  9 MZ504337.1       1
#> 10 MZ504299.1       1
#> # ℹ 344 more rows
GMYC
The GMYC method is run by executing the gmyc function and giving it an ape::phylo object. The GMYC method requires an ultrametric tree file of class phylo as input for analysis. BEAST trees generated in Tree Annotator need to be read in using the treeio:read.beast() function, and then need to be converted into a phylo object by using ape::as.phylo.
# beast_tree - the Nexus formatted ultrametric phylogenetic tree object supplied with this package

path_to_file <- system.file("extdata/geophagus_beast.nex", package = "delimtools")

beast_tree <- treeio::read.beast(path_to_file) |>
  ape::as.phylo()
Run delimitation.
Now, lets check the summary:
summary(gmyc_delim)
#> Result of GMYC species delimitation
#>
#>  method: single
#>  likelihood of null model:   995.0483
#>  maximum likelihood of GMYC model:   1010.027
#>  likelihood ratio:   29.95779
#>  result of LR test:  3.124266e-07***
#>
#>  number of ML clusters:  19
#>  confidence interval:    18-22
#>
#>  number of ML entities:  21
#>  confidence interval:    19-25
#>
#>  threshold time: -0.0164289
And let’s transform the results into a table using the gmyc_tbl function.
gmyc_df <- gmyc_tbl(gmyc_delim)

# print the dataframe
print(gmyc_df)
#> # A tibble: 137 × 2
#>    labels      gmyc
#>    <chr>      <int>
#>  1 GU701784.1     1
#>  2 GU701785.1     1
#>  3 MH780911.1     1
#>  4 OR732927.1     1
#>  5 JN988869.1     1
#>  6 OR732928.1     1
#>  7 MZ504387.1     2
#>  8 MZ504388.1     2
#>  9 MZ504369.1     2
#> 10 MZ504390.1     2
#> # ℹ 127 more rows
bGMYC
The bGMYC method is run by executing the bgmyc function and giving it an ape::phylo object. The bGMYC method requires an ultrametric tree file of class phylo as input for analysis. BEAST trees generated in Tree Annotator need to be read in using the treeio:read.beast() function, and then need to be converted into a phylo object by using ape::as.phylo.
# beast_tree already loaded and converted

bgmyc_delim <- bgmyc(beast_tree)
#> bGMYC (C engine): 137 tips, 11000 MCMC steps, 100 post-burnin samples
#> 10%
#> 20%
#> 30%
#> 40%
#> 50%
#> 60%
#> 70%
#> 80%
#> 90%
#> 100%
#> Acceptance rates (py / pc / t):
#> 0.5252  0.8393  0.3450
The results then need to be transformed into a table using the bgmyc_tbl function. By default, 0.05 is used as default posterior probability threshold for clustering samples into species partitions.
bgmyc_df <- bgmyc_tbl(bgmyc_delim)

print(bgmyc_df)
#> # A tibble: 137 × 2
#>    labels     bgmyc
#>    <chr>      <int>
#>  1 GU701784.1     1
#>  2 GU701785.1     1
#>  3 JN988869.1     1
#>  4 MH780911.1     1
#>  5 MZ050845.1     2
#>  6 MZ051032.1     2
#>  7 MZ051272.1     3
#>  8 MZ051516.1     3
#>  9 MZ051549.1     3
#> 10 MZ051706.1     2
#> # ℹ 127 more rows
PTP and mPTP
We can run both PTP and mPTP analysis by using the mptp function. Specifying the arguments (“multi” for mPTP; “single” for PTP) in the parameters determines which analysis is performed; the default is “multi” for mPTP. The mptp function accepts either phylo tree object or a Newick tree file. We can use either ape::read.tree() or treeio::read.newick() to read in our Newick file; it will be automatically stored as phylo object.
# raxml_tree - the Newick formatted phylogenetic tree object supplied with this package

path_to_file <- system.file("extdata/geophagus_raxml.nwk", package = "delimtools")

raxml_tree <- treeio::read.newick(path_to_file)
Run delimitation.
mptp_delim <- mptp(raxml_tree)
#> Score Null Model: 681.702507
#> Number of delimited species: 14
mptp_df <- mptp_tbl(mptp_delim)

print(mptp_df)
#> # A tibble: 137 × 2
#>    labels      mptp
#>    <chr>      <int>
#>  1 MZ051794.1     1
#>  2 MZ050845.1     1
#>  3 MZ051032.1     1
#>  4 MZ051706.1     1
#>  5 MZ504576.1     2
#>  6 MZ504578.1     2
#>  7 MZ504579.1     2
#>  8 MZ504588.1     2
#>  9 MZ504587.1     2
#> 10 MZ504592.1     2
#> # ℹ 127 more rows
For convenience we have made a ptp() wrapper around mptp() that defaults to the “single” argument of the method parameter. Similarly, we also made a ptp_tbl() wrapper around mptp_tbl().
# raxml_tree already loaded and converted

ptp_delim <- ptp(raxml_tree)
#> Score Null Model: 681.702507
#> Number of delimited species: 17
ptp_df <- ptp_tbl(ptp_delim)

print(ptp_df)
#> # A tibble: 137 × 2
#>    labels       ptp
#>    <chr>      <int>
#>  1 MZ051794.1     1
#>  2 MZ050845.1     1
#>  3 MZ051032.1     1
#>  4 MZ051706.1     1
#>  5 MZ504576.1     2
#>  6 MZ504578.1     2
#>  7 MZ504579.1     2
#>  8 MZ504588.1     2
#>  9 MZ504587.1     2
#> 10 MZ504592.1     2
#> # ℹ 127 more rows
To estimate a minimum branch length for your dataset, use minbr_len.
Morphology
We can also turn species ranks or results from morphological analysis into a species partition by using morph_tbl. For the geophagus dataset, we will use the scientific names in geophagus_info to accomplish this.
morph_df <- morph_tbl(labels = geophagus_info$gbAccession,
                      sppVector = geophagus_info$scientificName) |>
  dplyr::filter(labels %in% haps_df$labels)

print(morph_df)
#> # A tibble: 137 × 2
#>    labels     morph
#>    <chr>      <int>
#>  1 MZ504501.1     1
#>  2 MZ504504.1     1
#>  3 MZ504510.1     1
#>  4 MZ504543.1     1
#>  5 MZ504545.1     1
#>  6 MZ504488.1     1
#>  7 MZ504483.1     1
#>  8 MZ504558.1     1
#>  9 MZ504484.1     1
#> 10 MZ504502.1     1
#> # ℹ 127 more rows
Joining Species Delimitation Outputs
Since we have several species partitions, we need to merge them into a single data frame in order to visualize the results. However, since each method has its own rankings, we need to recode them prior to any further analysis. For this task, we can use delim_join. This function takes a list of species partitions to recode and then join.
all_delims <- list(abgd_df, asap_df, locmin_df, percent_df, treedist_df,
                   bgmyc_df, gmyc_df,
                   mptp_df, ptp_df,
                   morph_df)

all_delims_df <- delim_join(all_delims)
#> Warning: Dimensions are not the same across tables.
#> ✖ You've supplied inputs with different dimensions.
#> ℹ `delim 1` has 354 rows and 2 columns
#> ℹ `delim 2` has 137 rows and 2 columns
#> Dimensions are not the same across tables.
#> ✖ You've supplied inputs with different dimensions.
#> ℹ `delim 1` has 354 rows and 2 columns
#> ℹ `delim 2` has 137 rows and 2 columns
#> Dimensions are not the same across tables.
#> ✖ You've supplied inputs with different dimensions.
#> ℹ `delim 1` has 354 rows and 2 columns
#> ℹ `delim 2` has 137 rows and 2 columns
#> Dimensions are not the same across tables.
#> ✖ You've supplied inputs with different dimensions.
#> ℹ `delim 1` has 354 rows and 2 columns
#> ℹ `delim 2` has 137 rows and 2 columns
#> Dimensions are not the same across tables.
#> ✖ You've supplied inputs with different dimensions.
#> ℹ `delim 1` has 354 rows and 2 columns
#> ℹ `delim 2` has 137 rows and 2 columns
#> Dimensions are not the same across tables.
#> ✖ You've supplied inputs with different dimensions.
#> ℹ `delim 1` has 354 rows and 2 columns
#> ℹ `delim 2` has 137 rows and 2 columns
We can summarize the all_delims_df object by using the report_delim function.
report_delim(all_delims_df)
#> ℹ Joined delimitations have a total of 46 unique species partitions.
#> ℹ Check below the number of species partitions per method:
#>
#>
#> |method   | partitions|
#> |:--------|----------:|
#> |locmin   |         21|
#> |gmyc     |         21|
#> |abgd     |         19|
#> |bgmyc    |         18|
#> |ptp      |         17|
#> |morph    |         16|
#> |asap     |         14|
#> |mptp     |         14|
#> |percent  |         12|
#> |treedist |          7|
#> # A tibble: 137 × 11
#>    labels     abgd  asap  locmin percent treedist bgmyc gmyc  mptp  ptp   morph
#>    <chr>      <chr> <chr> <chr>  <chr>   <chr>    <chr> <chr> <chr> <chr> <chr>
#>  1 MZ504301.1 sp1   sp20  sp1    sp41    sp45     sp1   sp1   sp1   sp1   sp37
#>  2 MZ504318.1 sp1   sp20  sp1    sp41    sp45     sp1   sp1   sp1   sp1   sp37
#>  3 MZ504341.1 sp1   sp20  sp1    sp41    sp45     sp1   sp1   sp1   sp1   sp37
#>  4 MZ504337.1 sp1   sp20  sp1    sp41    sp45     sp1   sp1   sp1   sp1   sp37
#>  5 MZ504342.1 sp1   sp20  sp1    sp41    sp45     sp1   sp1   sp1   sp1   sp37
#>  6 MZ504304.1 sp1   sp20  sp1    sp41    sp45     sp1   sp1   sp1   sp1   sp37
#>  7 MZ504332.1 sp1   sp20  sp1    sp41    sp45     sp1   sp1   sp1   sp1   sp37
#>  8 MZ504343.1 sp1   sp20  sp1    sp41    sp45     sp1   sp1   sp1   sp1   sp37
#>  9 MZ504315.1 sp1   sp20  sp1    sp41    sp45     sp1   sp1   sp1   sp1   sp37
#> 10 MZ504345.1 sp1   sp20  sp1    sp41    sp45     sp1   sp1   sp1   sp1   sp37
#> # ℹ 127 more rows
We can also check the match ratio statistics of Ahrens et al (2014) using match_ratio.
match_ratio(all_delims_df) |>
  dplyr::arrange(dplyr::desc(match_ratio)) |>
            print(n=Inf)
#> # A tibble: 45 × 5
#>    pairs            delim_1 delim_2 n_match match_ratio
#>    <chr>              <int>   <int>   <int>       <dbl>
#>  1 abgd-locmin           19      21      17        0.85
#>  2 asap-percent          14      12      10        0.77
#>  3 bgmyc-gmyc            18      21      15        0.77
#>  4 abgd-bgmyc            19      18      14        0.76
#>  5 bgmyc-ptp             18      17      13        0.74
#>  6 abgd-ptp              19      17      13        0.72
#>  7 asap-ptp              14      17      11        0.71
#>  8 locmin-gmyc           21      21      15        0.71
#>  9 gmyc-ptp              21      17      13        0.68
#> 10 asap-morph            14      16      10        0.67
#> 11 locmin-bgmyc          21      18      13        0.67
#> 12 bgmyc-morph           18      16      11        0.65
#> 13 mptp-ptp              14      17      10        0.65
#> 14 asap-mptp             14      14       9        0.64
#> 15 locmin-ptp            21      17      12        0.63
#> 16 asap-bgmyc            14      18      10        0.62
#> 17 percent-ptp           12      17       9        0.62
#> 18 abgd-asap             19      14      10        0.61
#> 19 abgd-gmyc             19      21      12        0.6
#> 20 percent-bgmyc         12      18       9        0.6
#> 21 abgd-percent          19      12       9        0.58
#> 22 percent-morph         12      16       8        0.57
#> 23 abgd-morph            19      16       9        0.51
#> 24 asap-gmyc             14      21       9        0.51
#> 25 bgmyc-mptp            18      14       8        0.5
#> 26 gmyc-morph            21      16       9        0.49
#> 27 abgd-mptp             19      14       8        0.48
#> 28 percent-gmyc          12      21       8        0.48
#> 29 ptp-morph             17      16       8        0.48
#> 30 mptp-morph            14      16       7        0.47
#> 31 asap-locmin           14      21       8        0.46
#> 32 gmyc-mptp             21      14       8        0.46
#> 33 percent-mptp          12      14       6        0.46
#> 34 locmin-morph          21      16       8        0.43
#> 35 locmin-percent        21      12       7        0.42
#> 36 percent-treedist      12       7       4        0.42
#> 37 locmin-mptp           21      14       7        0.4
#> 38 asap-treedist         14       7       4        0.38
#> 39 treedist-mptp          7      14       4        0.38
#> 40 treedist-ptp           7      17       4        0.33
#> 41 abgd-treedist         19       7       4        0.31
#> 42 treedist-bgmyc         7      18       3        0.24
#> 43 locmin-treedist       21       7       3        0.21
#> 44 treedist-gmyc          7      21       3        0.21
#> 45 treedist-morph         7      16       2        0.17
By checking the results, all comparisons including treedist have a low match_ratio. Since species partitions with very low match_ratio values can impact consensus calculations, we will remove treedist before visualizing our results.
all_delims_df <- dplyr::select(all_delims_df, -treedist)

report_delim(all_delims_df)
#> ℹ Joined delimitations have a total of 44 unique species partitions.
#> ℹ Check below the number of species partitions per method:
#>
#>
#> |method  | partitions|
#> |:-------|----------:|
#> |locmin  |         21|
#> |gmyc    |         21|
#> |abgd    |         19|
#> |bgmyc   |         18|
#> |ptp     |         17|
#> |morph   |         16|
#> |asap    |         14|
#> |mptp    |         14|
#> |percent |         12|
#> # A tibble: 137 × 10
#>    labels     abgd  asap  locmin percent bgmyc gmyc  mptp  ptp   morph
#>    <chr>      <chr> <chr> <chr>  <chr>   <chr> <chr> <chr> <chr> <chr>
#>  1 MZ504301.1 sp1   sp20  sp1    sp41    sp1   sp1   sp1   sp1   sp37
#>  2 MZ504318.1 sp1   sp20  sp1    sp41    sp1   sp1   sp1   sp1   sp37
#>  3 MZ504341.1 sp1   sp20  sp1    sp41    sp1   sp1   sp1   sp1   sp37
#>  4 MZ504337.1 sp1   sp20  sp1    sp41    sp1   sp1   sp1   sp1   sp37
#>  5 MZ504342.1 sp1   sp20  sp1    sp41    sp1   sp1   sp1   sp1   sp37
#>  6 MZ504304.1 sp1   sp20  sp1    sp41    sp1   sp1   sp1   sp1   sp37
#>  7 MZ504332.1 sp1   sp20  sp1    sp41    sp1   sp1   sp1   sp1   sp37
#>  8 MZ504343.1 sp1   sp20  sp1    sp41    sp1   sp1   sp1   sp1   sp37
#>  9 MZ504315.1 sp1   sp20  sp1    sp41    sp1   sp1   sp1   sp1   sp37
#> 10 MZ504345.1 sp1   sp20  sp1    sp41    sp1   sp1   sp1   sp1   sp37
#> # ℹ 127 more rows
Visualizing Results
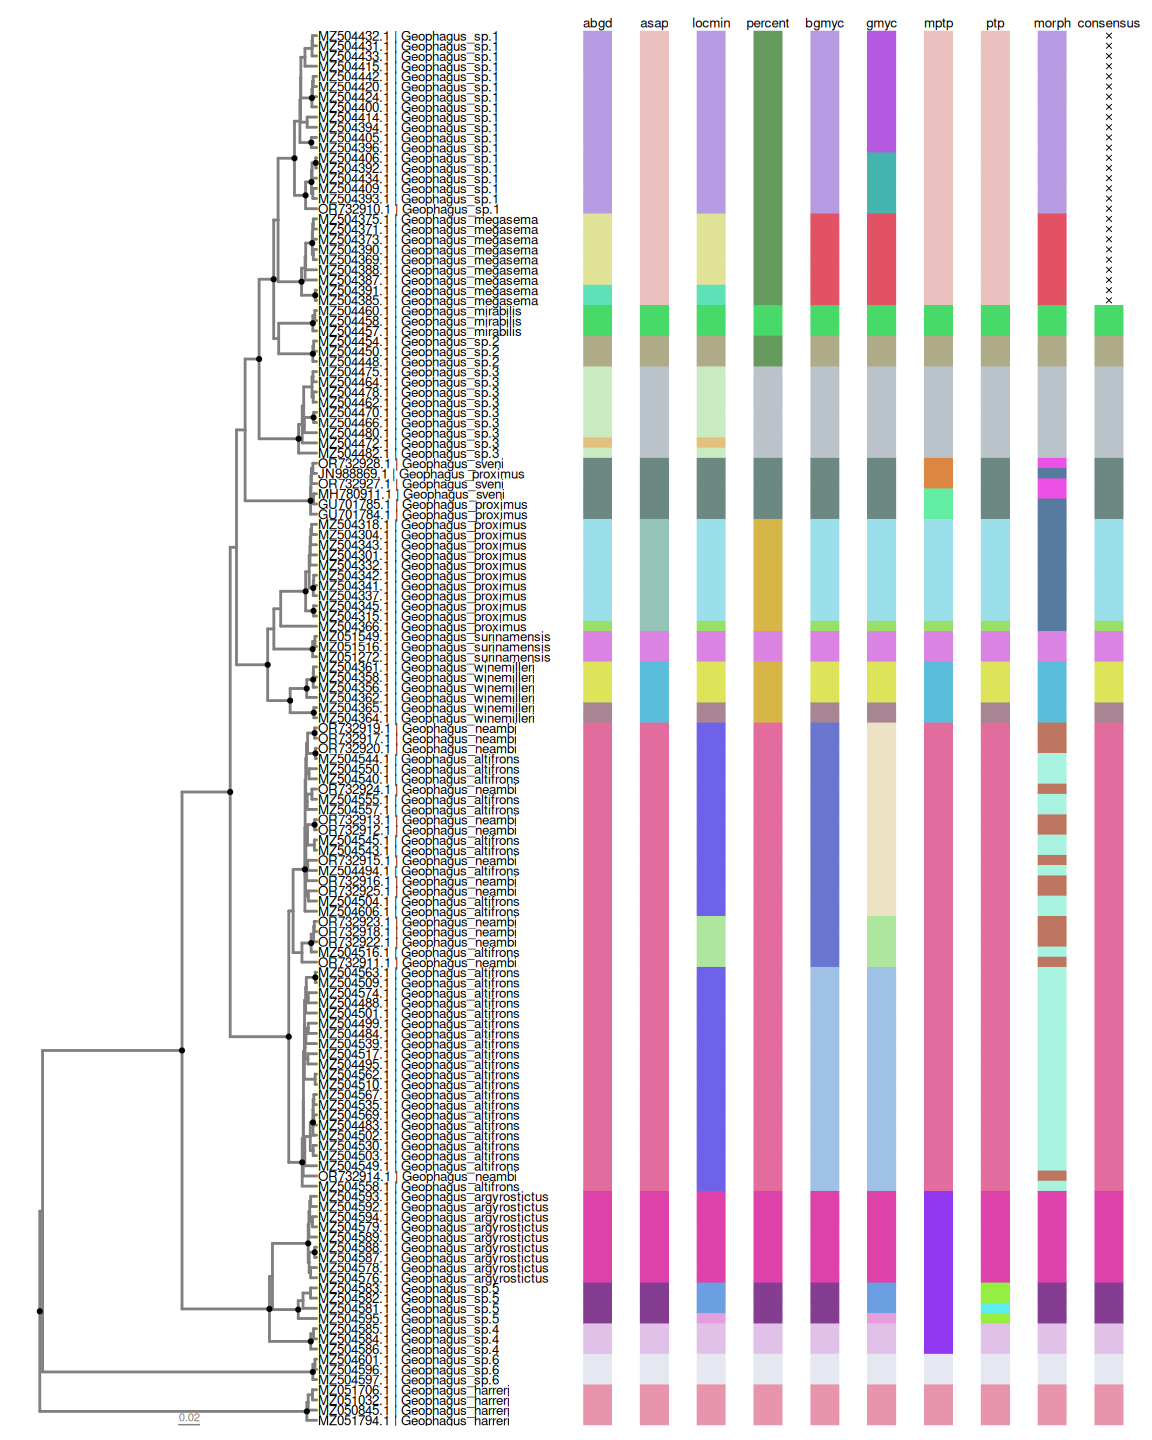
We can visualize the results by using delim_autoplot. This function will plot a phylogenetic tree alongside with the results contained in all_delims_df. We will use the geophagus_beast tree to visualize the results.
# geophagus_beast - the Nexus formatted ultrametric phylogenetic tree object used for visualization

path_to_file <- system.file("extdata/geophagus_beast.nex", package = "delimtools")

geophagus_tree <- treeio::read.beast(path_to_file)

# customize tip labels of the tree
tip_tab <- geophagus_info |>
  dplyr::filter(gbAccession %in% geophagus_beast@phylo$tip.label) |>
  dplyr::mutate(labs = glue::glue("{gbAccession} | {scientificName}")) |>
  dplyr::select(gbAccession, labs, scientificName)

# create a customized color palette
cols <- delim_brewer(delim = all_delims_df, package = "randomcoloR", seed = 42)

# plot
delim_autoplot(all_delims_df,
               geophagus_beast,
               consensus = TRUE,
               n_match = 5,
               tbl_labs = tip_tab,
               col_vec = cols,
               hexpand = 0.7,
               widths = c(0.5, 0.5))